What is Prometheus?
- Prometheus is an open-source systems monitoring and alerting toolkit.
- Prometheus collects and stores its metrics as time series data,
i.e. metrics information is stored with the timestamp at which it was recorded, alongside optional key-value pairs called labels.
Features
- a multi-dimensional data model with time series data identified by metric name and key/value pairs
- PromQL, a flexible query language to leverage this dimensionality
- no reliance on distributed storage; single server nodes are autonomous
- time-series collection happens via a pull model over HTTP

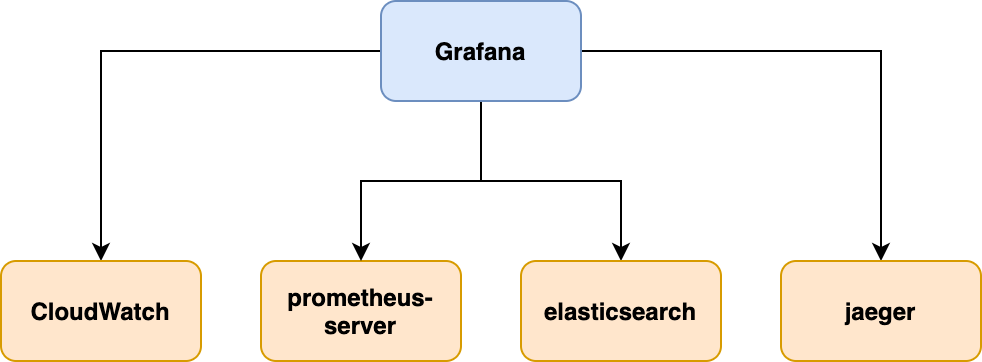
What is Grafana?
Grafana is the open source analytics & monitoring solution for every database.
Visualize metrics and alert with imag
'software engineering > devops' 카테고리의 다른 글
| Google Optimize (0) | 2022.08.25 |
|---|---|
| Optimizely (0) | 2022.08.25 |
| Sentry (0) | 2022.08.25 |
| Swagger (0) | 2022.08.25 |
| Doppler (0) | 2022.08.25 |
