When a server suffers from OOM. Sometimes, there are no proper methods to detect server restart.
And also don’t utilize memory monitoring on production go API services.
Heap dump can be retrieved by using pprof tool.
`curl http://ip address:5333/debug/pprof/heap > heap0.pprof`
If you want to use web interface, use following command.
`go tool pprof -http=:8080 heap.out`
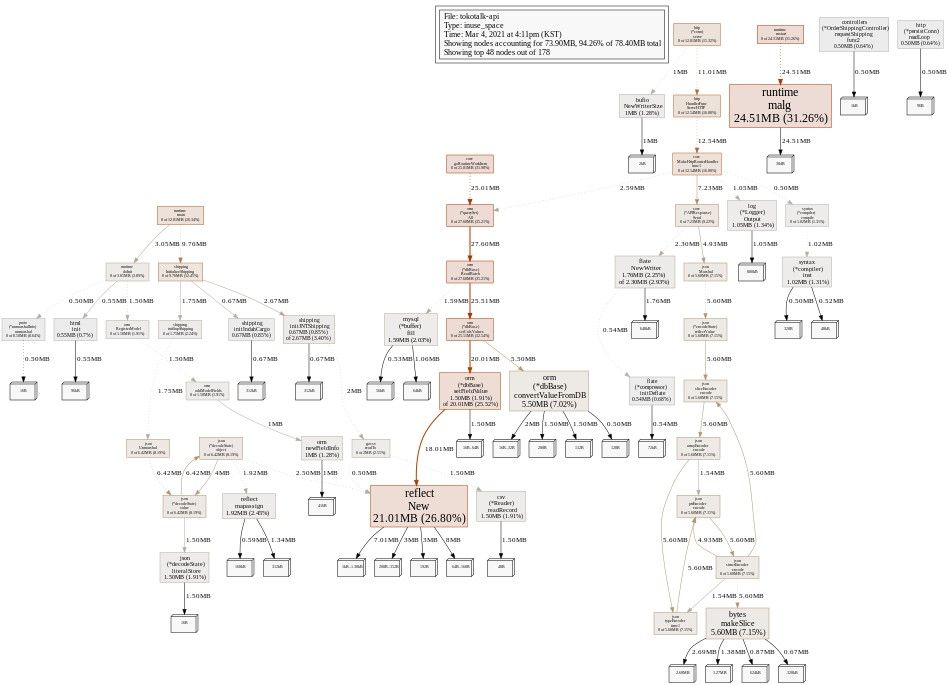
Example graph from heap dump of production instance
- heap_prod.pprof
- 04 Mar 2021, 04:57 PM
- goroutine_prod.pprof
- 04 Mar 2021, 04:57 PM
Investigation
https://utcc.utoronto.ca/~cks/space/blog/programming/GoNoMemoryFreeing
After several reading, I found article above which is Go doesn’t release memory back to the operating system. This means our server doesn’t have leak, so we might need to prepare other methods to return free memory back to operating system.

Solution
We decided to upgrade go with 1.16 latest stable versions. there are several changes related gc pacing and memory management. Will monitor memory usage after deploying with go v1.16.
References
'software engineering > backend' 카테고리의 다른 글
| DocumentDB Vs MongoDB (1) | 2022.08.26 |
|---|---|
| gRPC Error (0) | 2022.08.26 |
| Topicctl (Kafka management) (0) | 2022.08.25 |
| gRPC (0) | 2022.08.25 |
| Error (0) | 2022.08.25 |
